
India’s GDP growth rate reached 7.8% in the first quarter of FY26, according to the Ministry of Statistics and Programme Implementation. But despite its rapid economic growth, India’s GDP per capita remains lower than that of countries with slower-growing economies. So, how can an economy grow rapidly while its average output per person remains considerably lower than that of other countries?
See, this is a valid question.
And this debate touches a few fundamental economic concepts: Economic growth, population size, purchasing power, income distribution and human development. So, before we find the answer to this question, let’s understand the basics.
GDP Growth And GDP Per Capita Don’t Tell The Same Picture.
We often confuse GDP and GDP per capita, but these are two different indicators.
- GDP: It is the total market value of all the finished goods & services that are produced within the domestic territory of the country.
- Real GDP Growth: It is the rate at which economic output increases after adjusting for price changes.
- GDP per capita: It is GDP divided by the country’s population. It represents average economic output per person.
- GDP per capita (PPP): It is the GDP per person adjusted for differences in purchasing power between countries.
Hence, GDP growth measures a rate of change, whereas GDP per capita measures an average level and not the income actually received by people.
This means that a lower GDP per capita and a higher growth rate can co-exist. A lower GDP per capita doesn’t contradict a higher GDP growth rate.
Does A Dollar Buy The Same Things Everywhere?
GDP per capita measures a country’s average economic output per person using standard market exchange rates (nominal).
Whereas GDP per capita at Purchasing Power Parity (PPP) adjusts the value based on how much that output is worth locally.
For example, there are two people: Sam and Satyam. Sam lives in New York, and Satyam lives in Mumbai.
Their GDP per capita is $100 a day and $20 a day, respectively. Both want to buy potato chips, but in New York a dollar can buy Sam only one packet of chips, whereas in Mumbai a dollar can buy Satyam 5 packets of chips.
See this price difference? This situation is exactly the GDP per capita (PPP).
PPP adjusts for these price-level differences, which allows a more meaningful comparison of domestic purchasing power.
The Hypothetical Example:
Let us assume there are two countries (fictional), both have five people, and the income distribution in each country is given as:
| Person | Country A | Country B |
|---|---|---|
| 1 | ₹4 lakh | ₹2 lakh |
| 2 | ₹5 lakh | ₹3 lakh |
| 3 | ₹6 lakh | ₹4 lakh |
| 4 | ₹7 lakh | ₹5 lakh |
| 5 | ₹8 lakh | ₹26 lakh |
| Mean Income | ₹6 lakh | ₹8 lakh |
| Median Income | ₹6 lakh | ₹4 lakh |
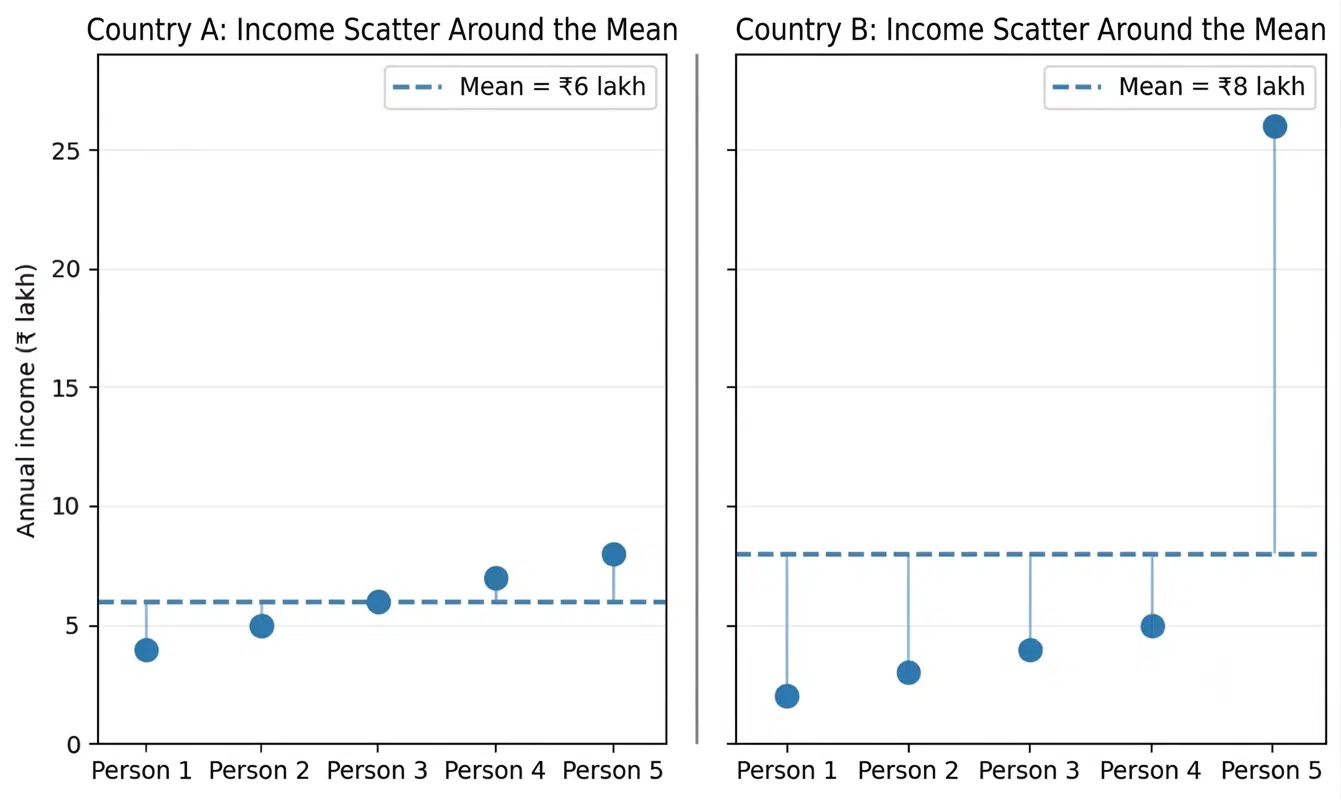
From this data, we can say that Country B has a higher mean because its total income is higher, but it is also visible that four out of five people earn less than the average income in Country A.
Hence, this indicates that why the average income cannot reveal the entire distribution.
When The Average Hides The Distribution.
Here the role of statistics comes in.
A. Mean And Median:
The mean is the total value divided by the number of observations.
The median is the middle value when observations are arranged in order.
This means that extremely high income can raise the mean considerably without producing a similar increase in others’ incomes.
B. Variance And Standard Deviation:
Variance shows how much a set of numbers spread from the average (mean) value. Standard deviation measures how much the data points spread from the average (mean). Variance is the square of standard deviation.
The spread of the data points from their mean can be illustrated as:
C. Gini Coefficient:
It is a statistical measure and it quantifies economic inequality within a nation.
D. Income Shares:
It is the proportion of total national income that goes to different factors of production, mainly labour (L) and capital (K).
The total income of Country A is ₹30 lakh, and that of Country B is ₹40 lakh. If we calculate the income share of the highest earner of both countries using the formula:
It comes out that the highest earner in Country A, i.e. Person 5, has 26.67% of the total income, and in Country B, the highest earner, i.e., Person 5, has 65% of the total income of the country.
Although Country B has a higher mean income than Country A, its income distribution is more concentrated.
One misinterpretation is that GDP per capita tells us how much income each person receives, which is not true; it just tells the average output per head and not the actual income received.
However, it is also important to understand that greater inequality doesn’t necessarily mean lower GDP growth.
Can Demographics Explain India’s Growth Potential?
Demographics of a country play a role too. Demographic situations are another major aspect of how the country will perform economically.
India has a relatively younger population, which can support economic expansion.
How?
Because of a larger young population:
- The proportion of the working-age population increases,
- and the non-working dependents-to-working-age ratio changes,
- which increases the importance of education, skills, labour productivity, and health.
- and the importance of creating jobs for young people increases.
This means that a growing workforce can increase the economy’s productive capacity, but only if workers find employment and contribute effectively to production.
Growth Is Important, But What Does It Deliver?
See, rapid real GDP growth indicates that India’s economic output is expanding, and India still has a lower GDP per capita as compared to other slow-growing economies. But India’s PPP-adjusted GDP per capita is nearly four times higher than its nominal GDP per capita, which means that India has a high local purchasing power.
Also, India has higher income inequality, due to which average measures may not reflect everyone’s circumstances. This bigger picture indicates that India is growing and growth takes time; although there are some possible negatives, a lower GDP per capita doesn’t make a high growth rate false.
However, it is important to understand that GDP is a growth measure and doesn’t directly tell the development story; for this, we need to look at measures beyond GDP, i.e., development measures.
Beyond GDP
Now, comes the question: How do we assess economic performance and development then?
- Human Development Index (HDI): It measures a country’s overall achievement in social and economic dimensions and is published by the United Nations Development Programme (UNDP). It evaluates nations across three core areas: health, education, and standard of living.
- Inequality-adjusted Human Development Index (IHDI): It measures how the achievements are actually distributed across the population.
So, India should be assessed through these indicators:
| Indicator | What It Tells |
|---|---|
| Real GDP Growth | The rate at which economic output is expanding. |
| GDP Per Capita (PPP) | Average output adjusted for price differences. |
| Gini Coefficient | Inequality in income or consumption distribution. |
| Employment And Wages | How growth connects to work and earning. |
| HDI/IHDI | Human development and inequality-adjusted outcomes. |
Note that no single indicator is sufficient to rank the overall quality of the economy, because each measure has a different dimension.
What Does India’s Growth Story Tell Us?
Yes, India is the fastest-growing economy and has a lower GDP per capita and a lower GDP per capita does not invalidate rapid economic growth, just the same as a higher GDP per capita doesn’t guarantee better outcomes for every citizen.
Growth rates, average output, purchasing power, income distribution and human development should also be assessed together. Hence, economic performance can’t be reduced to a single number: growth tells us how quickly an economy is expanding, while per capita and development indicators help us understand what that expansion means for its people.
Author
Ms. Nidhi Sharma
Student
Biyani Group of Colleges, Jaipur